Earth Science worksheet
    Topic: Magnitude And Scale
    Magnitude And Scale
    1

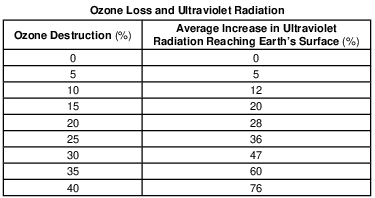
    The graph below shows the relationship between the distance that wind blows over a body of water and the height of the waves that are generated.

    reference-tables, planetary-wind-and-moisture-belts-in-the-troposphere, meteorology, weather-basics-and-observable-patterns, standard-1-math-and-science-inquery, velocity-slope-sediment-size-channel-shape-stream-valume-distance-from-the-sun-gravitational-force-period-of-revolution-speed-of-revolution, standard-1-math-and-science-inquery, changing-length-of-a-shadow-based-on-the-motion-of-the-sun, standard-6-interconnectedness, magnitude-and-scale fig: esci-v202-exam_g8.png

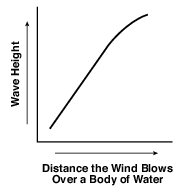
    A west wind blowing with the same velocity would generate the highest waves along the shoreline at

    (1) Jamestown

    (2) Oswego

    (3) Plattsburgh

    (4) Riverhead

    2

    The diagram below is a portion of a geologic timeline. Letters A through D represent the time intervals between the labeled events, as estimated by scientists.

    geologic-history, reference-tables, earth-history, earth-history, geologic-time-units-and-the-events, standard-6-interconnectedness, magnitude-and-scale fig: esci12012-examw_g25.png

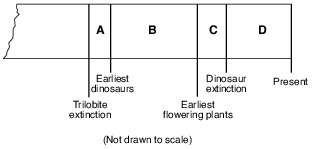
    Fossil evidence indicates that the earliest birds developed during which time interval?

    (1) A

    (2) B

    (3) C

    (4) D

    3

    The timeline below represents time on Earth from the beginning of the Paleozoic Era (A) to the present (B).

    earth-history, evolution-of-life-forms-and-the-free-oxygen-in-the-atmosphere, standard-1-math-and-science-inquery, changing-length-of-a-shadow-based-on-the-motion-of-the-sun, standard-6-interconnectedness, models, standard-6-interconnectedness, magnitude-and-scale fig: esci12015-examw_g22.png

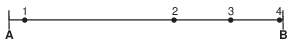
    Which numbered position best represents the time when humans first appeared in the fossil record?

    (1) 1

    (2) 2

    (3) 3

    (4) 4

    4

    On the map of the United States shown below, four lines have been drawn and labeled A, B, C, and D.

    reference-tables, key-to-weather-map-symbols, insolation-and-the-seasons, variations-of-insolation, meteorology, the-atmosphere, standard-1-math-and-science-inquery, changing-length-of-a-shadow-based-on-the-motion-of-the-sun, standard-6-interconnectedness, models, standard-6-interconnectedness, magnitude-and-scale fig: esci12016-examw_g14.png

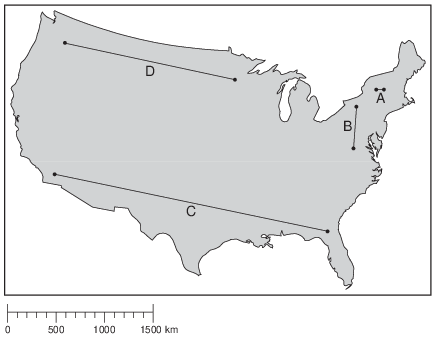
    The length of which line best represents the distance from Earth’s surface to the top of the mesosphere?

    (1) A

    (2) B

    (3) C

    (4) D

    5

    The diagram below represents a model of the size of the Sun and indicates the color of the Sun.

    reference-tables, characteristics-of-stars, seasons-and-astronomy, stars, standard-1-math-and-science-inquery, changing-length-of-a-shadow-based-on-the-motion-of-the-sun, standard-6-interconnectedness, models, standard-6-interconnectedness, magnitude-and-scale fig: esci12017-examw_g13.png

    Which diagram best represents the relative size and indicates the color of Polaris compared to the Sun?
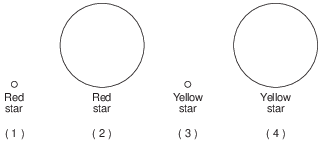
    reference-tables, characteristics-of-stars, seasons-and-astronomy, stars, standard-1-math-and-science-inquery, changing-length-of-a-shadow-based-on-the-motion-of-the-sun, standard-6-interconnectedness, models, standard-6-interconnectedness, magnitude-and-scale fig: esci12017-examw_g14.png

    (1) 1

    (2) 2

    (3) 3

    (4) 4

    Base your answers to questions 6 on the topographic map in image provided and on your knowledge of Earth science. Partially drawn contour lines are shown on the southern portion of the map. Points of elevation are recorded in meters. Points A, B, C, and D represent locations on Earth’s surface. Line AB and dashed line CD are reference lines.
    6

    Describe the evidence shown by the contour lines that indicates that Bry Creek flows downhill in a southwesterly direction. [1]

    Allow 1 credit. Acceptable responses include, but are not limited to:

    • — Contour lines bend upstream when they cross Bry Creek.

    • — Contour lines make V shapes that point northeast at Bry Creek.

    • — The creek flows out of the open end of the Vs.

    • — Bry Creek flows from a higher to a lower contour line.

    • — Elevations decrease toward the southwest.

    • Note: Do not allow credit for “water flows downhill” alone because it is stated in the question.

    Base your answers to questions 7 on the timeline in image provided and on your knowledge of Earth science. The timeline represents the last 600 million years of geologic time. Shaded area A represents the Neogene Period.
    7

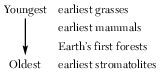
    List the following organisms in order of geologic age from youngest to oldest: earliest mammals, earliest stromatolites, earliest grasses, Earth’s first forests. [1]

    geologic-history, reference-tables, earth-history, standard-1-math-and-science-inquery, changing-length-of-a-shadow-based-on-the-motion-of-the-sun, standard-6-interconnectedness, magnitude-and-scale fig: esci-v202-ansbk_abkq7.png

    Allow 1 credit if all four organisms are listed in the correct order as shown below.

    geologic-history, reference-tables, earth-history, standard-1-math-and-science-inquery, changing-length-of-a-shadow-based-on-the-motion-of-the-sun, standard-6-interconnectedness, magnitude-and-scale fig: esci-v202-rg_g7.png

    Base your responses to questions 8 on the passage below.

    Frozen Mammoth

    A wooly mammoth was found in 1999 buried in the frozen soil of the Siberian tundra. Carbon-14 dating indicated that it had died about 20,000 years ago. Many fossils represent only the partial remains of organisms. However, a complete mammoth with bones, skin, hair, and internal organs intact represented a unique opportunity for scientists to investigate the lifestyle of this animal and the environment in which it lived.

    8

    Identify both the period and epoch of geologic time during which the wooly mammoth lived. [1]

    Period

    Epoch

    Allow 1 credit if both responses are correct: Quaternary Period and Pleistocene Epoch.

    Base your answers to questions 9 on the passage and map of a portion of the East African Rift system shown below. Point X represents a location on Earth’s surface within a rift valley on the Ethiopian Dome.

    The Great Rift Valley

    Rifting of Earth’s crust in eastern Africa began during the Neogene Period as the Ethiopian and Kenyan Domes formed. These two huge domes were created as Earth’s mantle pushed up the overlying crust. As the crust was forced upward, the resulting tension cracked the crust, resulting in the eruption of volcanoes and the formation of large rifts. The crust continued to pull apart, forming rift valleys. These valleys have become deeper and are currently becoming filled with sediments, igneous rock, and water.

    geologic-history, reference-tables, earth-history, earth-history, relative-age-and-sequence-of-rock-strata, standard-1-math-and-science-inquery, geocentric-model-heliocentric-model, standard-6-interconnectedness, magnitude-and-scale fig: esci12012-examw_g37.png

    9

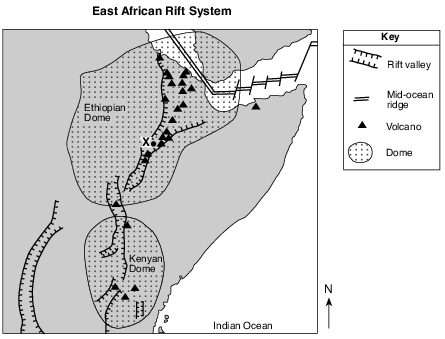
    How many million years ago did the Ethiopian and Kenyan Domes form? [1]

    million years ago

    Allow 1 credit for any value from 23 million years ago to 1.8 million years ago.

    Base your answers to questions 10 on the map and passage below.

    A Lake-Effect Snowstorm

    A snowstorm affected western New York State on October 12 and 13, 2006. A blend of weather conditions caused more than 24 inches of heavy, wet, lake-effect snow, bringing much of western New York to a standstill. The New York State Thruway was closed to traffic between exits 46 and 59, which are circled on the map. The isolines on the map show the amount of snowfall, measured in inches, resulting from this storm. Points A and B represent locations on Earth’s surface.

    meteorology, presentation-of-weather-data, meteorology, weather-variables, standard-6-interconnectedness, models fig: esci12013-exam_g43.png

    10

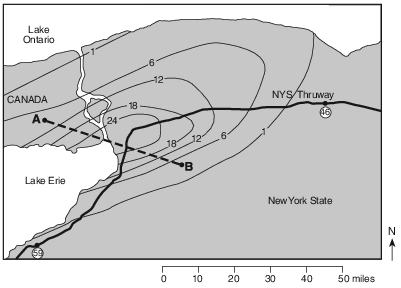
    Approximately how many miles of this section of the Thruway were closed due to the snowstorm? [1]

    mi

    Allow 1 credit for any value from 93 mi to 107 mi.

    Base your answers to questions 11 on the diagram below and on your knowledge of Earth science. The diagram represents the present position of our solar system in a side view of the Milky Way Galaxy. The distance across the Milky Way Galaxy is measured in light-years.

    seasons-and-astronomy, stars, standard-6-interconnectedness, models fig: esci12014-examw_g35.png

    11

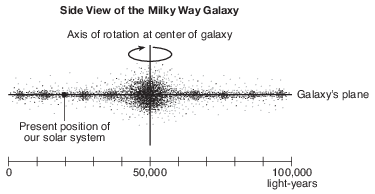
    List the following astronomical features, in order of relative size, from smallest to largest. [1]

    Sun

    Jupiter

    Milky Way Galaxy

    Universe

    Our solar system

    reference-tables, solar-system-data, seasons-and-astronomy, stars, standard-6-interconnectedness, magnitude-and-scale fig: esci12014-ansbk_abkq9.png

    Allow 1 credit if all five astronomical features are listed in the correct order as shown below.

    reference-tables, solar-system-data, seasons-and-astronomy, stars, standard-6-interconnectedness, magnitude-and-scale fig: esci12014-rg_g9.png

    Base your answers to questions 12 on the weather map in image provided and on your knowledge of Earth science. The weather map shows the center of a high-pressure system (H) and the center of a low-pressure system (L) affecting North America. Isobars are drawn for the eastern portion of the map, and one isobar is drawn around the high-pressure center. Air pressures are shown at various points in the western portion of the map. All air pressures were recorded in millibars (mb). Points A through F represent surface locations.
    12

    Identify one possible air pressure at the center of the low-pressure system. [1]

    ______________ mb

    Allow 1 credit for any value greater than 988 but less than 992 mb.
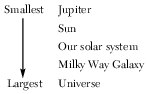
    Base your answers to questions 13 on the passage, cross section, and map below and on your knowledge of Earth science. The cross section represents the relative movement of two tectonic plates, labeled A and B, at the Mariana Trench. Arrows in the plates indicate the direction of this movement.

    Challenger Deep

    Challenger Deep is the deepest known point in Earth’s oceans. This relatively narrow depression, only 7 miles long and 1 mile wide, is located in the bottom of the southern end of the Mariana Trench near the Mariana Islands, which includes the island of Guam. Challenger Deep is 6.83 miles deep, compared to Mount Everest, which is 5.49 miles above sea level.

    dynamic-earth, plate-tectonics, standard-1-math-and-science-inquery, changing-length-of-a-shadow-based-on-the-motion-of-the-sun, standard-6-interconnectedness, models fig: esci12019-examw_g44.png

    13

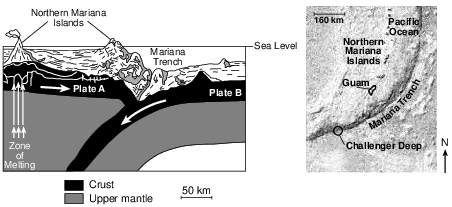
    The diagram in the image provided represents the depth of Challenger Deep. For comparison, on the Height of Mount Everest scale to the right, draw a horizontal line across the scale to indicate the height above sea level of Mount Everest. [1]

    dynamic-earth, earth-surface-features, landscapes, standard-1-math-and-science-inquery, eccentricity-rate-gradient-standard-error, standard-6-interconnectedness, magnitude-and-scale fig: esci12019-ansbk_abkq3.png

    Allow 1 credit if the student-drawn line is within or touches the rectangle shown.

    • Note: Do not allow credit if the student line is only on the “Depth of Challenger Deep” graph,

    • because that is depth below sea level.

    • It is recommended that an overlay of the same scale as the student answer booklet be used to ensure reliability in rating.

    dynamic-earth, earth-surface-features, landscapes, standard-1-math-and-science-inquery, eccentricity-rate-gradient-standard-error, standard-6-interconnectedness, magnitude-and-scale fig: esci12019-rg_g3.png

    Base your answers to questions 14 on the data table below and on your knowledge of Earth science. The data table shows how the destruction of the ozone layer in Earth’s atmosphere has affected the amount of ultraviolet radiation reaching Earth’s surface beneath the areas of ozone destruction.

    insolation-and-the-seasons, variations-of-insolation, standard-1-math-and-science-inquery, eccentricity-rate-gradient-standard-error fig: esci12019-examw_g49.png

    14

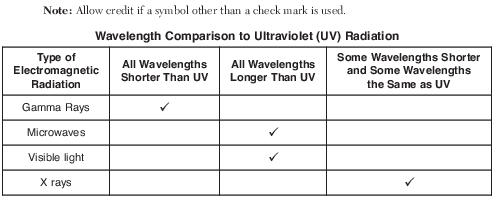
    On the table in the image provided, place one check mark in each row to compare the relative wavelengths of other types of electromagnetic radiation to ultraviolet (UV) radiation. [1]

    Wavelength Comparison to Ultraviolet (UV) Radiation reference-tables, electromagnetic-spectrum, insolation-and-the-seasons, variations-of-insolation, seasons-and-astronomy, electromagnetic-energy, standard-1-math-and-science-inquery, velocity-slope-sediment-size-channel-shape-stream-valume-distance-from-the-sun-gravitational-force-period-of-revolution-speed-of-revolution, standard-1-math-and-science-inquery, changing-length-of-a-shadow-based-on-the-motion-of-the-sun, standard-6-interconnectedness, magnitude-and-scale fig: esci12019-ansbk_abkq8.png

    Allow 1 credit for a correctly completed chart as shown below.

    reference-tables, electromagnetic-spectrum, insolation-and-the-seasons, variations-of-insolation, seasons-and-astronomy, electromagnetic-energy, standard-1-math-and-science-inquery, velocity-slope-sediment-size-channel-shape-stream-valume-distance-from-the-sun-gravitational-force-period-of-revolution-speed-of-revolution, standard-1-math-and-science-inquery, changing-length-of-a-shadow-based-on-the-motion-of-the-sun, standard-6-interconnectedness, magnitude-and-scale fig: esci12019-rg_g7.png

    Base your answers to questions 15 on the geologic cross section below and on your knowledge of Earth science. The cross section represents sedimentary rock units labeled A through D, a layer of volcanic ash deposits, and a basalt extrusion. An unconformity is present between rock units B and C. Line XY represents a fault. The rock layers have not been overturned.

    reference-tables, scheme-for-metamorphic-rock-identification, rocks-and-minerals, formation-classification-and-application-of-rocks, standard-1-math-and-science-inquery, changing-length-of-a-shadow-based-on-the-motion-of-the-sun, standard-6-interconnectedness, models fig: esci12019-examw_g50.png

    15

    Determine the relative age sequence of the following geologic features, in order from oldest to youngest: [1]

    (cid:129) Basalt (cid:129) Fault XY (cid:129) Volcanic ash

    earth-history, earth-history, relative-age-and-sequence-of-rock-strata, standard-6-interconnectedness, models, standard-6-interconnectedness, magnitude-and-scale fig: esci12019-ansbk_abkq9.png

    Allow 1 credit for the correct sequence as shown below.

    earth-history, earth-history, relative-age-and-sequence-of-rock-strata, standard-6-interconnectedness, models, standard-6-interconnectedness, magnitude-and-scale fig: esci12019-rg_g8.png